Applied Fieldwork
Highcliffe Case Study
|
Questions 1. Define the terms qualitative and quantitative data - give examples - include diagrams. Qualitative data is based on opinions (for example surveys) whereas quantitative data is based on facts and figures (for example graphs and tables) 2. Define the terms primary and secondary data collection. If you go to the beach and measure the width and angle of it, you are collecting a primary source of data whereas if you refer to a map or picture you are collecting a secondary source of data. 3. Define the terms random data, stratified data and systematic data.
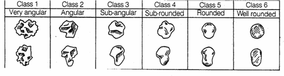
4. Describe how each type of data can be collected. 5. Define the term transect. Transect- a straight line or narrow section through an object or natural feature or across the earth's surface, along which observations are made or measurements taken. 6. Describe how your collected your data on the field trip. We took a tape measure and layed it from the sea to the edge of the path in a perpendicular line from the coast. Using systematic data we measure the angle change every 3 meters. We put meter ruler sticks at every 3 meters and measured the angle by using a clinometer gun. We also measured the length, height and width of pebbles every 3 meters using a quadrat and taking a pebble from each corner. We measured this using calipers. Then we measured the volume by putting them in water and measuring the difference when the pebbles were in the water. To record the shape of the pebbles use the Power's chart (see below). Note 1 – 3 have definite points whereas 4 – 6 do not. From this chart you can also decide how spherical it is – hence 2 drawing per box – don’t go there! Results and Conclusion |
Here is a list of the equipment we used: 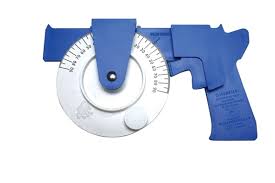
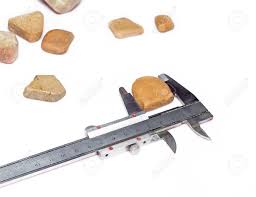
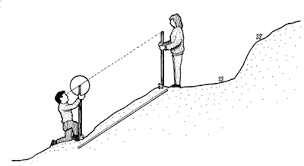
|
